

As AI becomes a core component of operational environments, the complexity of the systems IT operations teams must manage is changing. Applications have become more distributed, Kubernetes environments continue to expand, and digital services depend on a wide range of components, from internal infrastructure to external APIs, third-party providers, and AI models and agents.
In this environment, what operations teams need is not simply more dashboards. They need an intelligent framework that unifies signals across complex systems, provides context, and helps them act quickly. In June 2026, Splunk unveiled new Splunk Observability capabilities aligned with this direction at Cisco Live.
This article summarizes the key Splunk Observability capabilities announced at Cisco Live across three areas.
☑️ What Is Agentic Observability?
Agentic Observability is an observability framework in which AI agents support operations teams' incident response by detecting anomalies, analyzing root causes, and suggesting next actions. While traditional monitoring focused on delivering the signal that "something is wrong," agentic observability is evolving to also provide "what happened, why it matters, and what to do next."
With this announcement, Splunk unveiled capabilities to implement this approach across enterprise operations. There are three main directions: AI-driven automation of incident detection and resolution, extending observability across the entire AI stack, and unifying technical signals with business impact.
☑️ AI-Powered Observability: From Incident Detection to Resolution
■ AI SRE: Agentic AI Joins the Incident Response Team
AI SRE is a new agentic AI capability in Splunk Observability Cloud, scheduled for GA (general availability) at the end of June 2026. It automates the entire process from anomaly detection and root cause analysis to remediation planning and recovery guidance.
While traditional observability relied on manual monitoring and dashboard checks, AI SRE uses LLM-based reasoning to detect problems first and suggest a response direction. For operations teams, this creates an environment where they can reduce the time spent on initial response and focus on recovery.
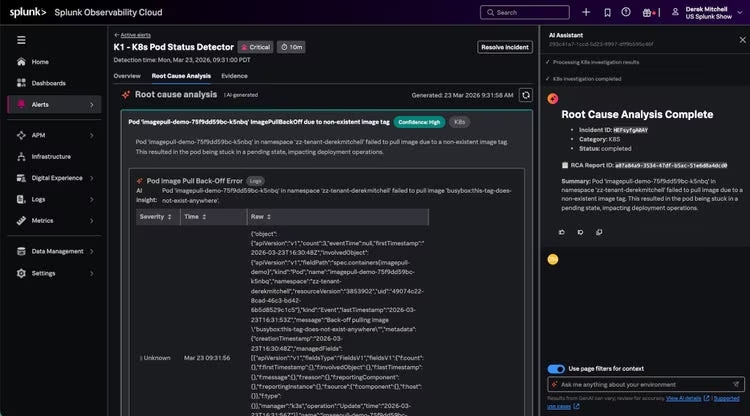
■ Cisco AI Canvas and ITSI Integration: Changing the Starting Point of Incident Investigation
When an incident occurs, the first thing a team does is assess the situation. Previously, they had to gather alerts, KPI trends, service status, entity information, and more by switching between multiple screens.
The integration of Cisco AI Canvas and Splunk IT Service Intelligence (ITSI) changes this process. When an ITSI episode is opened in AI Canvas, information such as service configuration, KPIs, related alerts, similar episodes, and linked tickets is loaded automatically. Prompts tailored to the incident are also provided. This capability is currently in Alpha.
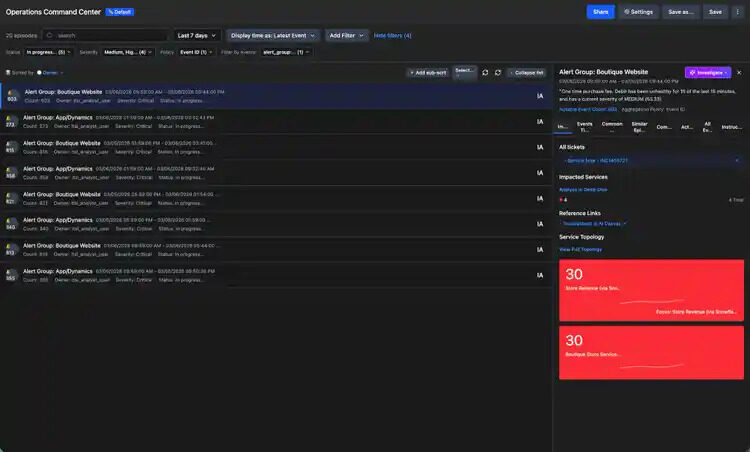
■ ITSI Event iQ Detect: Alert Grouping That Learns from Analyst Feedback
Event iQ Detect has already supported alert grouping using machine learning. This update adds the ability to incorporate analyst feedback directly into training.
When analysts split incorrectly grouped episodes or merge separate episodes into one during episode review, that feedback is reflected in retraining the Event iQ model. Over time, alert grouping accuracy improves, as does the quality of episode titles and correlation summaries. Admins can manage retraining schedules, approval settings, and automatic training options directly in policy settings. This capability is scheduled to be included in the ITSI 5.0 release in June 2026.
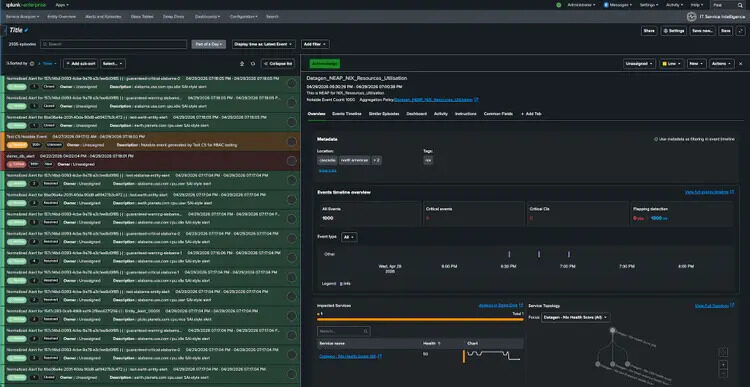
■ ITSI Event iQ Diagnose: Viewing Root Cause Analysis Results on a Single Screen
Event iQ Diagnose uses LLMs to automatically generate situation summaries for ITSI episodes. What happened, when it started, the key contributing events, and the probable cause and recommended actions can all be viewed on a single screen in the Impact tab of episode review. Summaries can also be shared with team members or sent to external tools such as ServiceNow.
If Event iQ Detect groups alerts, Event iQ Diagnose explains the resulting episode. This capability is also scheduled to be included in the ITSI 5.0 release in June 2026.
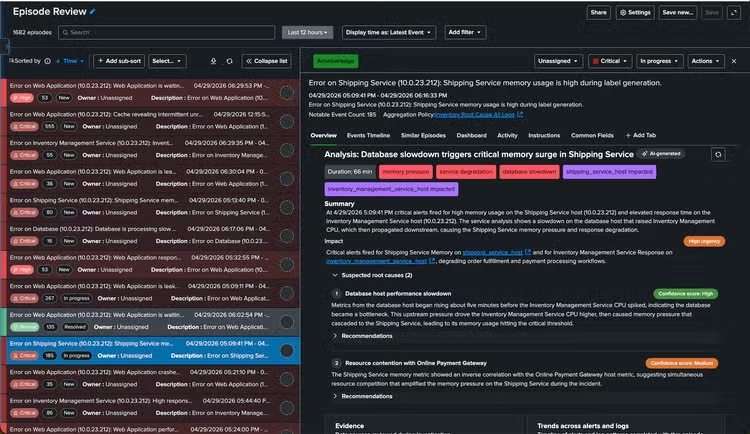
☑️ AI Observability: AI Agents Need Monitoring Too
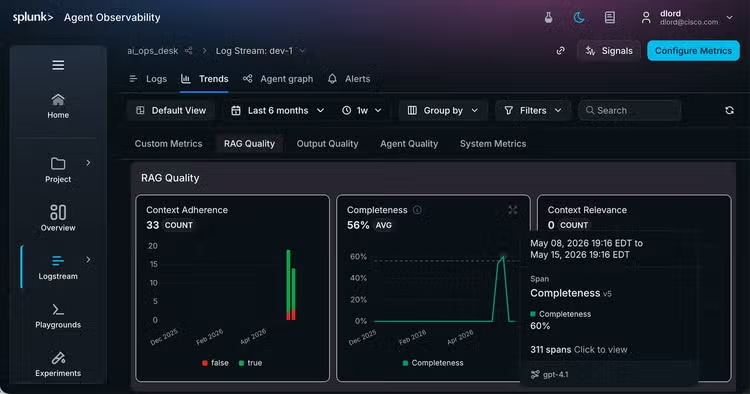
■ Splunk Agent Observability: Managing the Operational Quality of AI Agents
Once AI agents are deployed in production, the question arises of how to verify the quality of the agents' own behavior. Splunk Agent Observability addresses this problem.
With Cisco's completed acquisition of Galileo, Galileo's evaluation capabilities, real-time guardrails, and low-latency, cost-efficient evaluation technology have been integrated into Splunk Observability. Splunk Agent Observability evaluates and monitors AI agents throughout their development lifecycle and provides capabilities to block harmful outputs and control costs.
☑️ Unified Observability: Connecting Signals to Business Impact
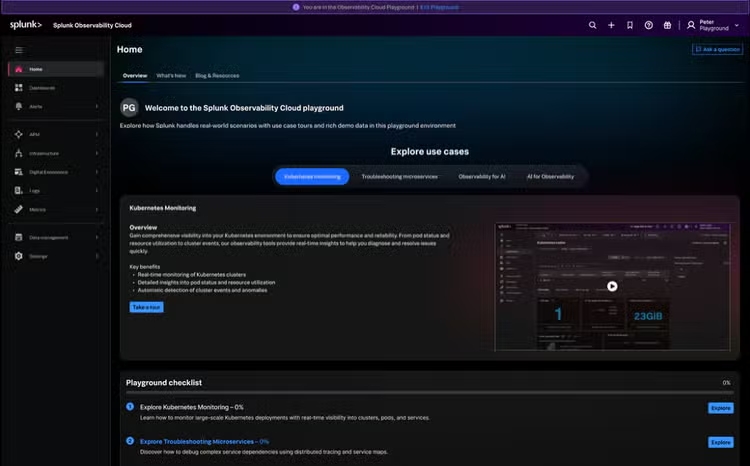
■ Observability Cloud Free Edition: A Free Plan You Can Start Without Limits, Now Generally Available
Splunk Observability Cloud Free Edition is now generally available. Instead of the previous 14-day trial, it provides free access to enterprise-grade capabilities within a limit of 15 hosts. Because the scope is defined by the number of hosts rather than by restricting specific features, developers and AI engineers can build in-depth integrations and dashboards from the early stages.
■ ThousandEyes Network Insights and Synthetic Monitoring Integration: Application and Network Layers in One Place
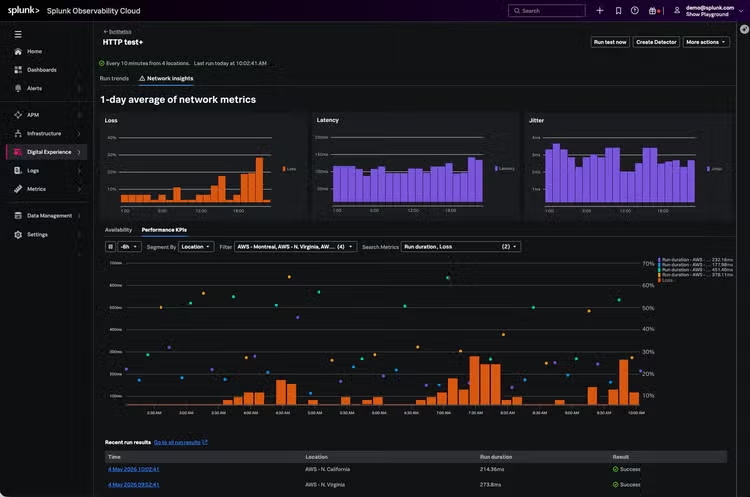
When application and network monitoring are separated, it takes time to determine whether the cause of an outage lies in the application or the network. Integrating Synthetic Monitoring in Splunk Observability Cloud with ThousandEyes allows application-layer and network-layer tests to be created and managed in one place.
It provides global visibility through more than 1,000 cloud agents in 271 cities across 69 countries and supports in-depth network diagnostics such as DNS resolution, BGP routing, and hop-by-hop path analysis. This integration is scheduled to enter Alpha in July 2026.
■ Runtime Application Attack Detection: Integrating Application Security and Observability
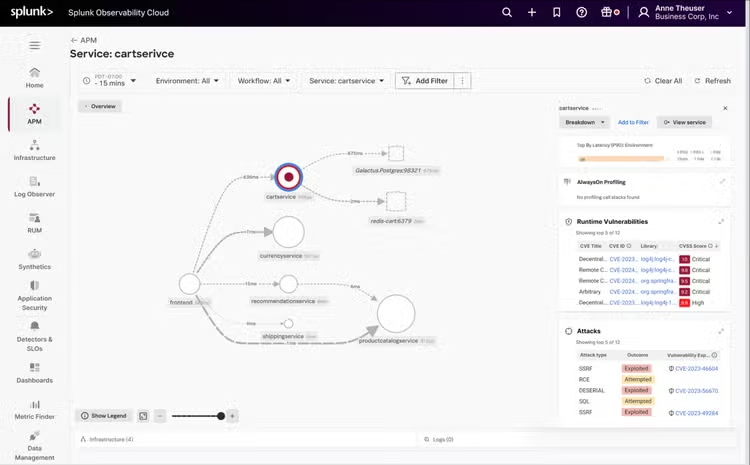
As AI accelerates software development, the likelihood of security vulnerabilities in code is also increasing. Splunk Secure Application adds security capabilities to existing observability tools. It prioritizes application threats and vulnerabilities based on business context and connects runtime threat data directly to Splunk Enterprise Security, creating a foundation for collaboration between application teams and security teams. This capability is currently generally available (GA).
■ Log-Based Charting and Alerting: Logs, Metrics, and Traces in a Single Interface
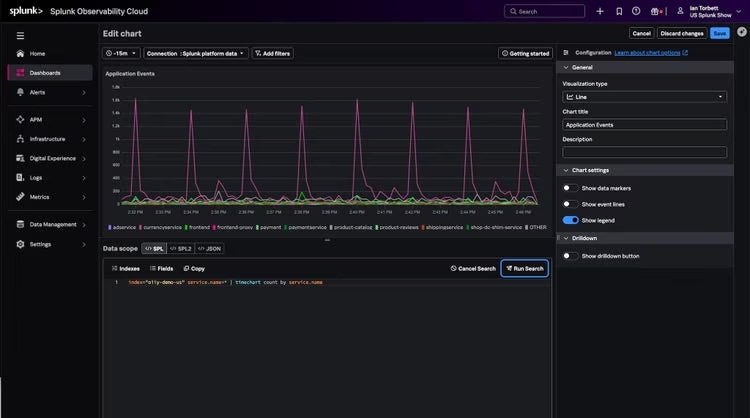
Managing log data in separate tools from metrics and traces creates the inefficiency of switching between multiple tools during incident response. The integration of log-based charting and alerting into Splunk Observability Cloud reduces this problem. SPL-based analysis combined with AI assistance can be used to improve log data visibility and MTTD/MTTR. This capability is scheduled for general availability in July 2026.
☑️ Frequently Asked Questions
Q. What is Agentic Observability?
A. Agentic observability is an observability framework that automates operations teams' incident response by having AI agents detect system anomalies, analyze root causes, and suggest remediation directions. Splunk implements this through capabilities such as AI SRE, Event iQ Detect, and Event iQ Diagnose.
Q. How is AI SRE different from traditional SRE operations?
A. While traditional SRE operations involve manually analyzing root causes after receiving alerts, AI SRE automates anomaly detection, root cause analysis, and remediation planning through LLM-based reasoning. Operations teams can reduce repetitive initial response work and focus on actual recovery.
Q. What environments need Splunk Agent Observability?
A. It is needed in environments where AI agents handle real work in production. It can be used to monitor agent output quality, the occurrence of harmful responses, and cost trends, and to apply real-time guardrails to improve operational reliability.
Q. Who is Splunk Observability Cloud Free Edition suited for?
A. It is suited for teams such as developers, startups, and AI engineers who want to build an integrated environment from the start without a trial period limit. Enterprise-grade capabilities are available within a limit of 15 hosts.
Q. What are the key benefits of integrating ThousandEyes with Splunk Synthetic Monitoring?
A. Application-layer and network-layer tests can be managed in a single interface, making it possible to quickly determine whether the cause of an outage lies in the application or the network. In-depth network diagnostics such as DNS, BGP, and hop-by-hop path analysis can be combined with application telemetry to improve MTTR.
☑️ If You Are Considering Splunk Observability
The direction Splunk emphasized in this announcement is evolving observability into an operational intelligence framework. In environments where AI agents take part in operations, collecting logs and metrics alone is not enough. What is needed is a framework that connects system signals to business context, monitors the behavior of the AI stack itself, and automates the operational flow from detection to remediation.
As an official Splunk partner, CloudNetworks can support the evaluation of Splunk Observability adoption tailored to each customer's environment. If you are considering how to design an observability framework for your current operational environment or how to start monitoring your AI stack, please contact us through the link below.
▶ Splunk View Products
[Source : Splunk, "Splunk Observability at Cisco Live: Agentic Observability for the AI Era"]